
I once again have been looking at my blood sugar readings, and notably on a fasting
day since this really is my “baseline” – ie what my body does naturally when there is no food to “artificially” raise my blood sugar.
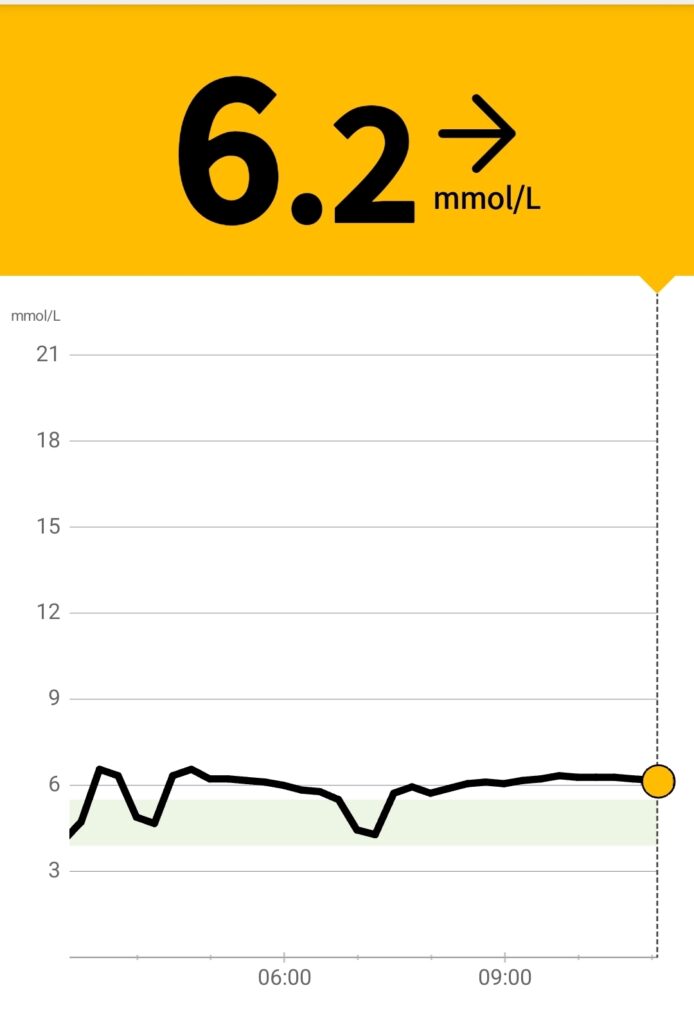
I’m back to my regular 36 hour fasting schedule today, and at over 12 hours into my fast, I took the screenshot on the right from the Libre Link app that receives my blood sugar reading from my Continuous Glucose Monitor (CGM), the sensor plugged into my arm..
As you can see at that point I was sitting at around 6.2 mmol/L (~112 mg/dL in US units).
The “safe” or “healthy” target range, represented by the light green band, is 4.6 – 5.5 mmol/L (83 – 100 mg/dL).
As I mentioned previously, my body seems to be producing glucose by itself – which is “as designed” – it’s how we evolved to survive long famines. There is no other rational explanation. My readings were a little higher than I might like at that point, but it seems like it’s nothing to worry about.
I posted about this on Facebook recently and someone had a similar experience, suggesting that their fasting numbers gradually lowered over a period of a few years of switching to a ketogenic diet. As he said “we spent decades beating up our body, so we have to give it time to adjust!”
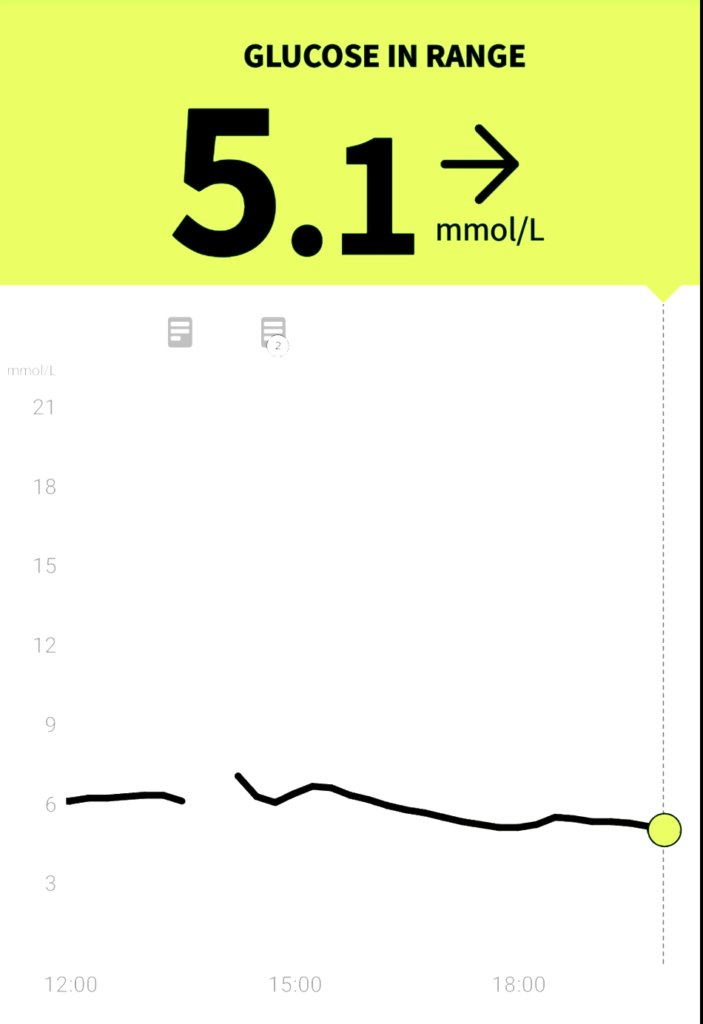
This afternoon I went for my swim, and once again you can see there was a rise in glucose – it doesn’t show smoothly since I was in the pool, away from my phone – hence the broken line. By the time I was back in range of my phone, you can see right after the broken line it was already starting to drop, and then it levelled out again but steadily sinking lower through the evening.
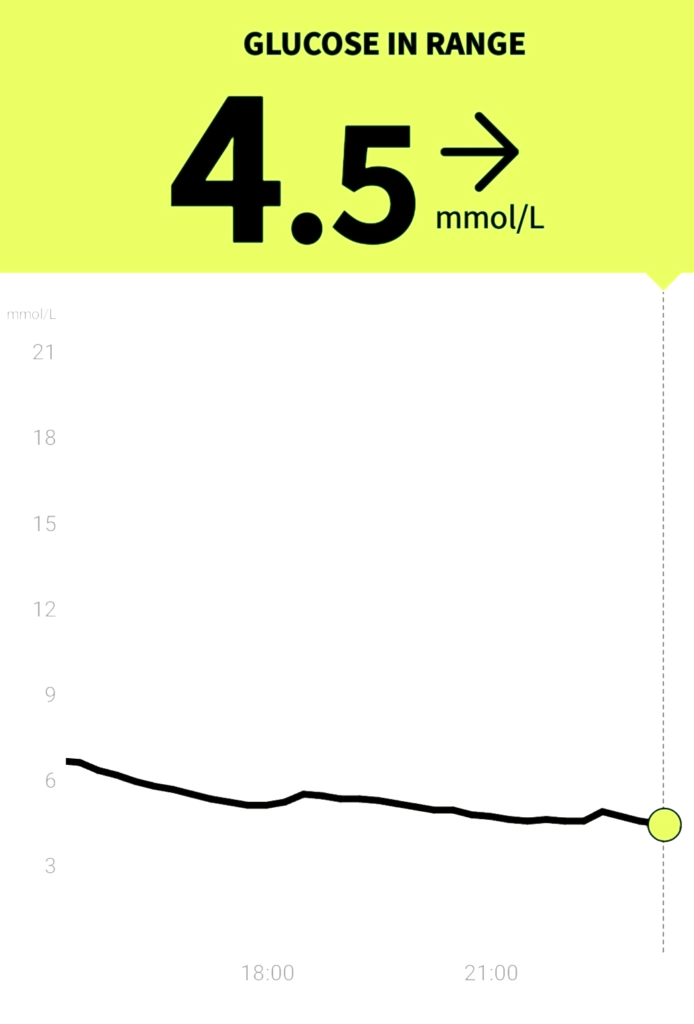
At 11:30 pm, over 24 hours into my extended fast, my CGM said I had settled back down at a very healthy 4.5 mmol/L, as you can see below.
The following morning, now about 34 hours into my 36 hour fast, I was very pleased to see I’d had a really good night.
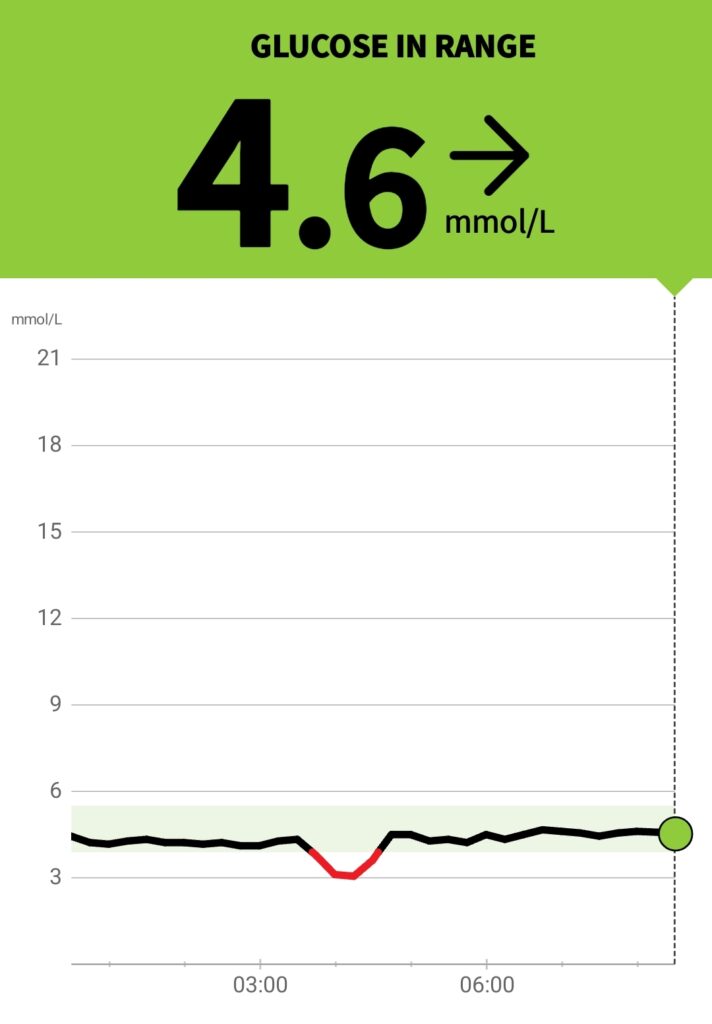
My glucose on waking was 4.6 mmol/L (83 mg/dL), just a fraction of a point up from when I went to bed, and as you can see from the graph to the left, it was flat all night except for one dip.
As I’ve discussed before, these sudden dips overnight are invariably (for me!) not real blood sugar dips, they are what are referred to as “compression dips”. I often lie on my left side, cradling my head on my left arm, which is where the CGM sensor attaches. The pressure of my weight against my arm pushes some interstitial fluid away from the area, preventing the sensor from detecting all the glucose as it should, resulting in a false low reading.
While Type 1 diabetics, or Type 2s taking insulin, might see sudden drops (hypoglycaemia) due to genuine blood sugar issues or over medicating with insulin, for a Type 2 like myself, especially one highly fat adapted, it’s incredibly unlikely that I’d see a genuine “hypo” as they are colloquially called.
So ignoring my compression dip, as you can see my blood sugar overnight was practically perfect!
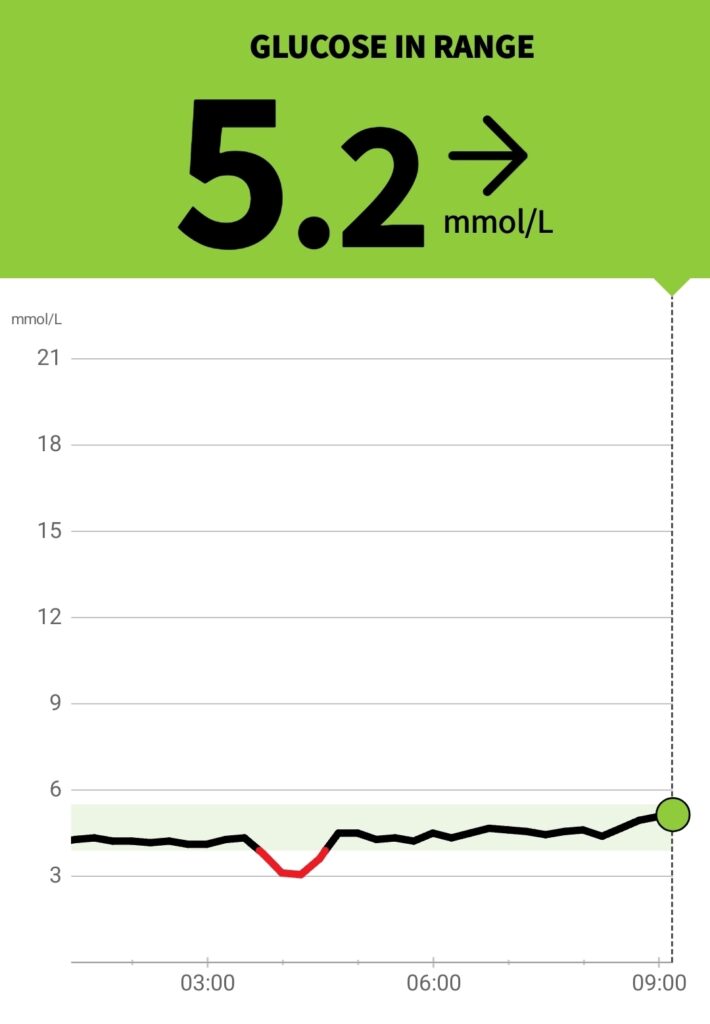
This morning it began to climb as I awoke, but at a much slower, steadier pace than I’ve seen on some mornings; as I’ve spoken about before this is the “dawn phenomenon” where your body prepares itself for the day by releasing cortisol and adrenaline to wake you up, resulting in the liver releasing glucose to provide energy.
But today it was really very slow and gentle, rising from 4.6 to 5.4 but then levelled off at 5.2 as you can see from the screenshot to the right.
I must confess I’m still struggling a little to interpret my results, as sometimes, like yesterday and overnight, it does exactly what I might expect, but at other times it completely surprises me.
Clearly, it’s not quite as straightforward as I hoped it might be.
Leave a Reply